
![]()
Energy use changes in NYC
Spring 2020
Columbia University Graduate School of Architecture, Planning and Preservation
Exploring Urban Data with Machine Learning
Seminar
Location
New York City, NY
City Scale
Critics
Boyeong Ho
Team
Niharika Shekhawat, Kate Galbo, Savannah Wu
An Analysis of Built & Social Factors that Influence Energy use from 2012-2017 Using LL84 Energy Disclosure Data. Buildings in New York City continue to be the largest contributor to greenhouse gas emissions (GHG), accounting for 66% of total citywide emissions followed by transportation (30 percent) and waste (4 percent).
Local Law 97 was passed in May of 2019, which requires 40% reduction of emissions by 2030, from a 2005 baseline, for buildings greater than 25,000 sq feet. Local Law 84 requires buildings to submit energy and water benchmarking data. It looks at private buildings above 25,000 sqft and public sector buildings above 10,000 sqft.
Local Law 97 was passed in May of 2019, which requires 40% reduction of emissions by 2030, from a 2005 baseline, for buildings greater than 25,000 sq feet. Local Law 84 requires buildings to submit energy and water benchmarking data. It looks at private buildings above 25,000 sqft and public sector buildings above 10,000 sqft.
Our research question: What social and built variables impact energy efficiency performance of residential buildings?
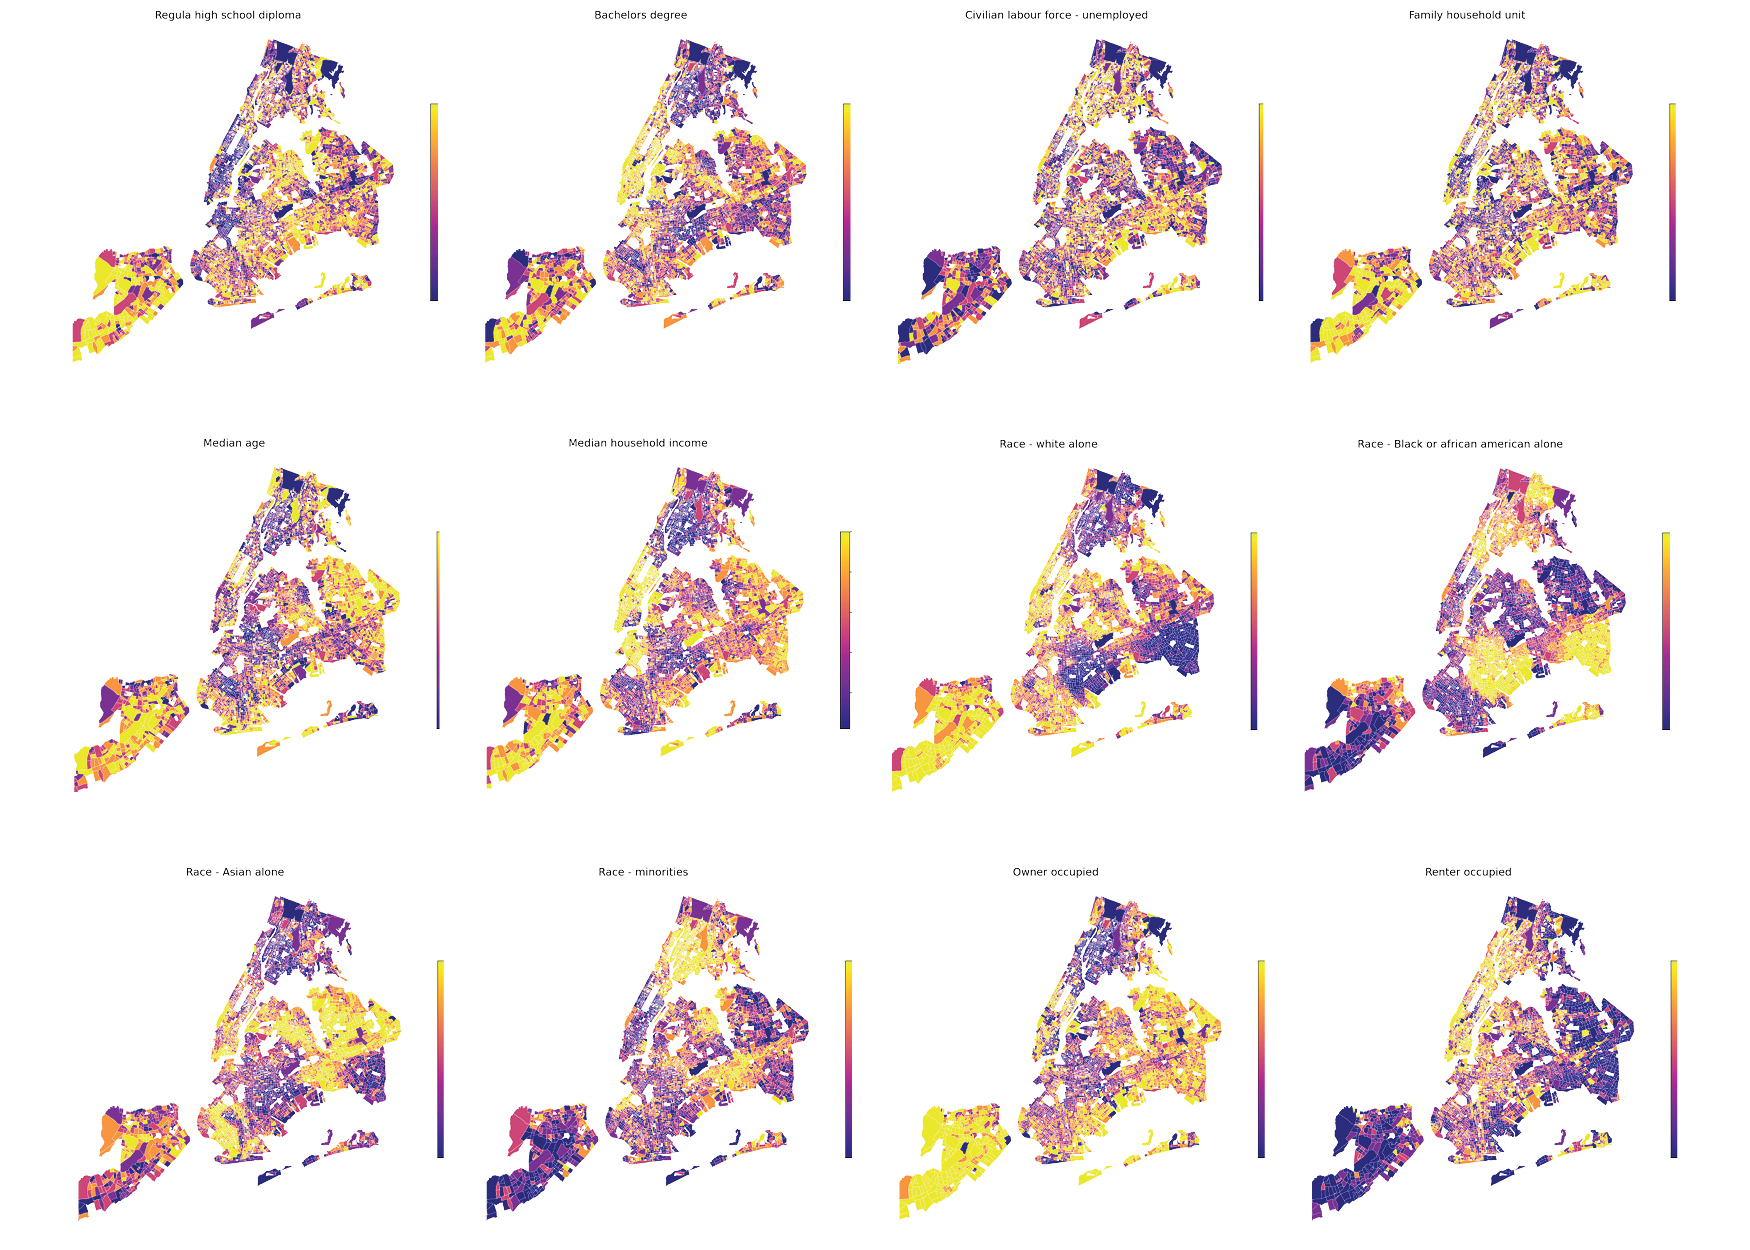 Social indicators taken into account and maps for exploratory analysis.
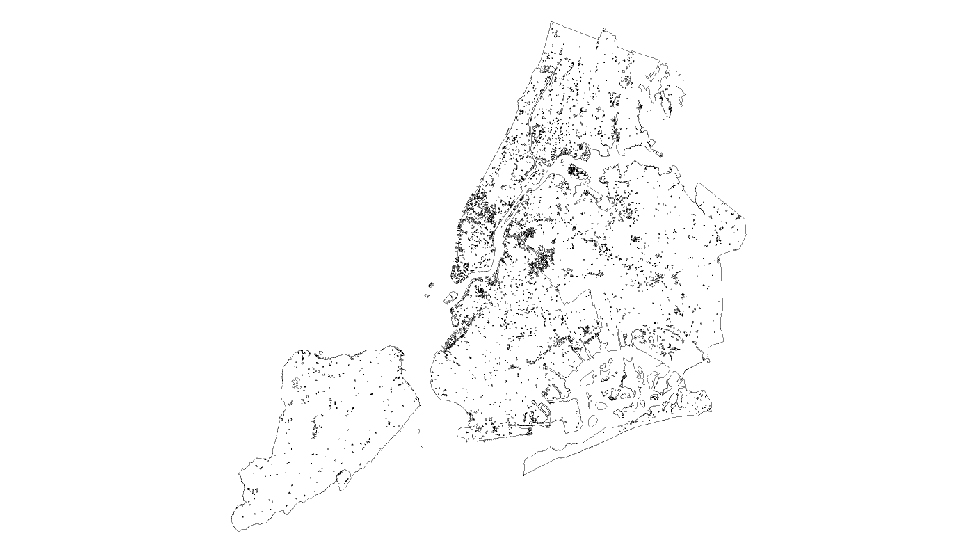
Data Sources are Local Law 84 energy disclosure data, PLUTO data, American Community survey data and NYC building footprint. Project scope and methodology, can be broken down into two parts: data cleaning and exploration and machine learning modeling.
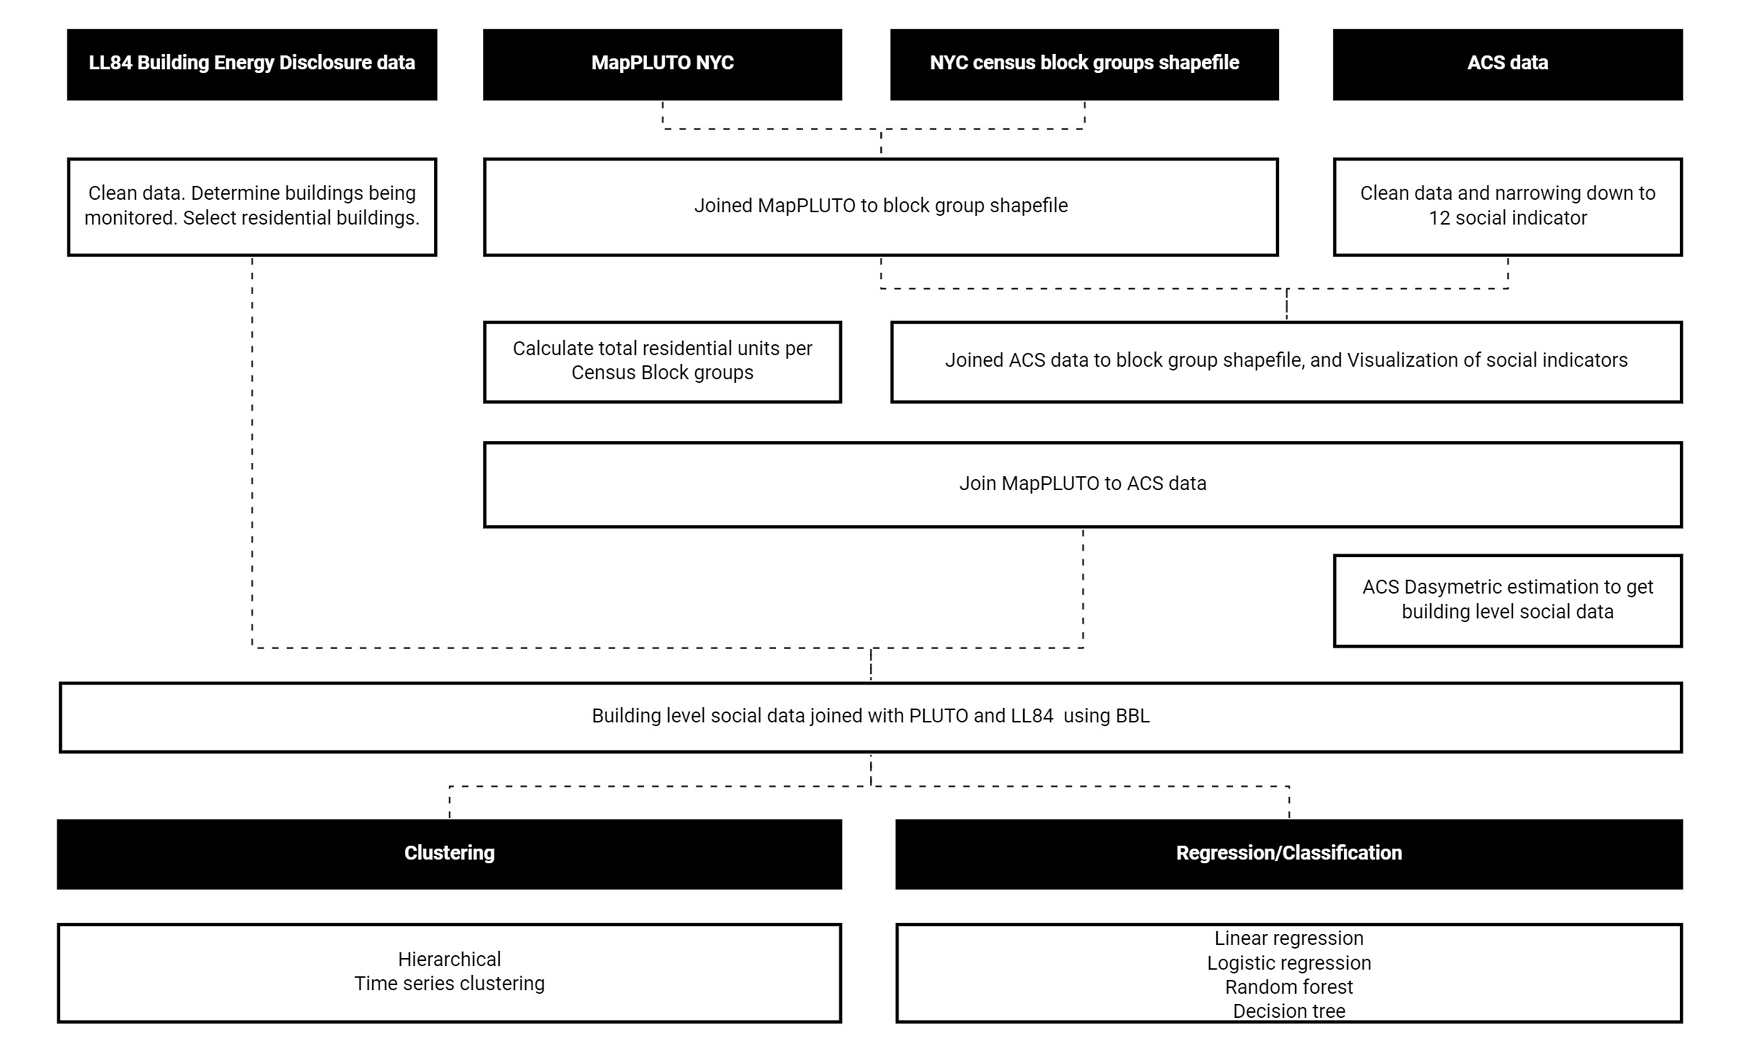 Methodology flow diagram. Our project scope, is broken down into two parts: Data cleaning and exploration bas AND conducting machine learning modeling
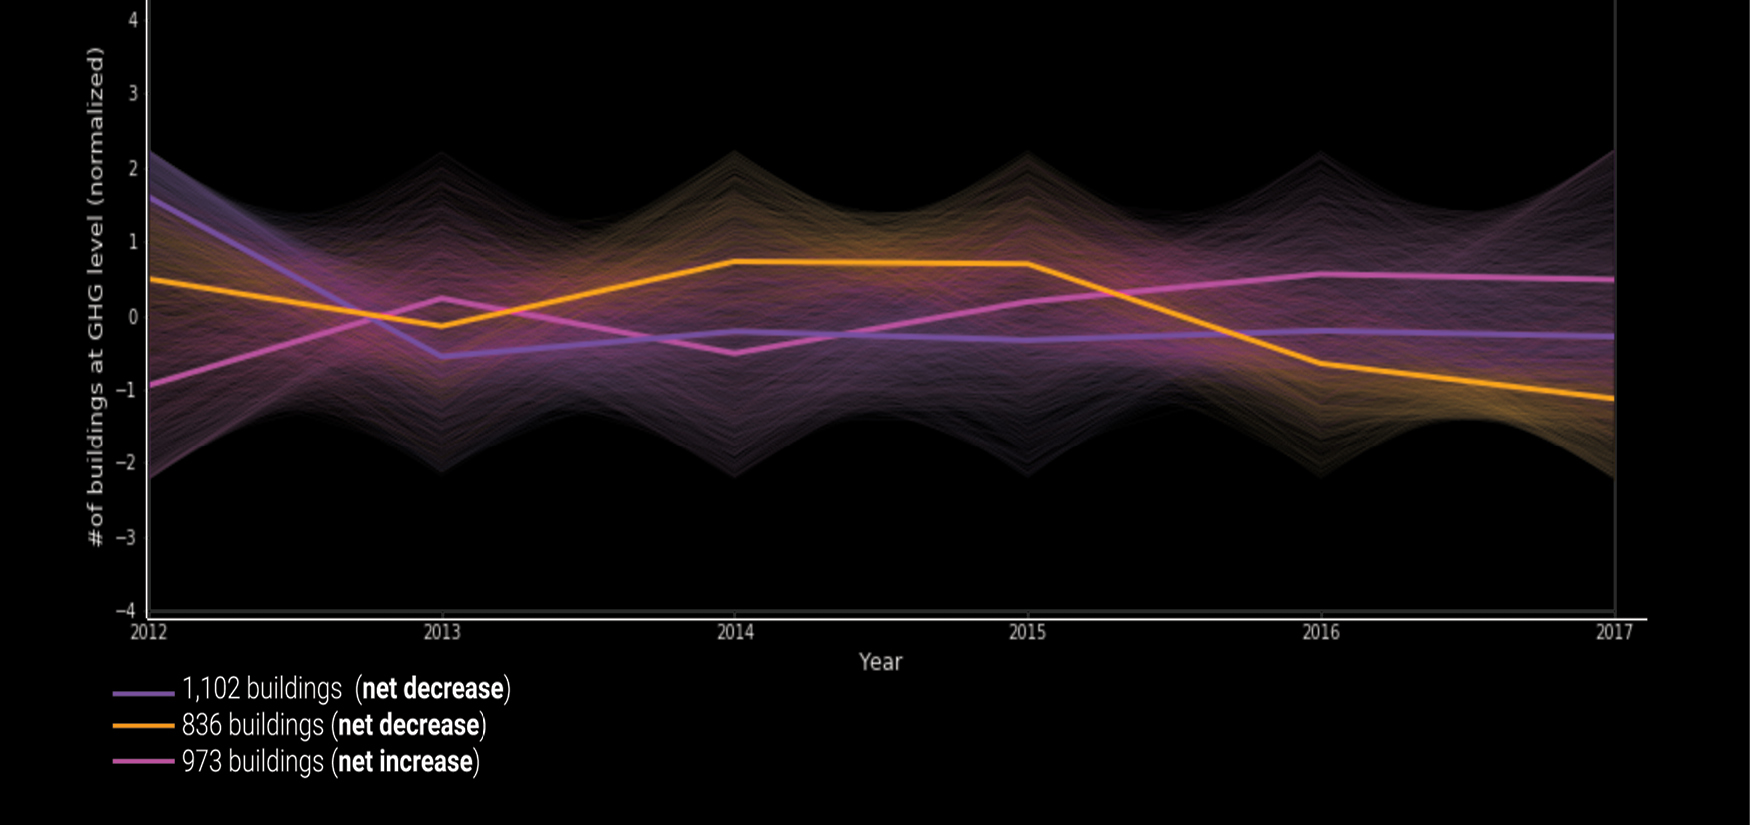
The results of clustering, measured the change in EUI and GHG emissions intensity from 2012 to 2017, and ran K-Means and hierarchical (agglomerative) clustering algorithms to look for similar buildings. The tests yielded the same results, with four (4) optimal clusters. Looking further at the agglomerative clustering results and the distribution of EUI and GHG emissions intensity change for each group, we found that cluster 1 included buildings with high decreasing values. Cluster 2 had values with high increasing values.
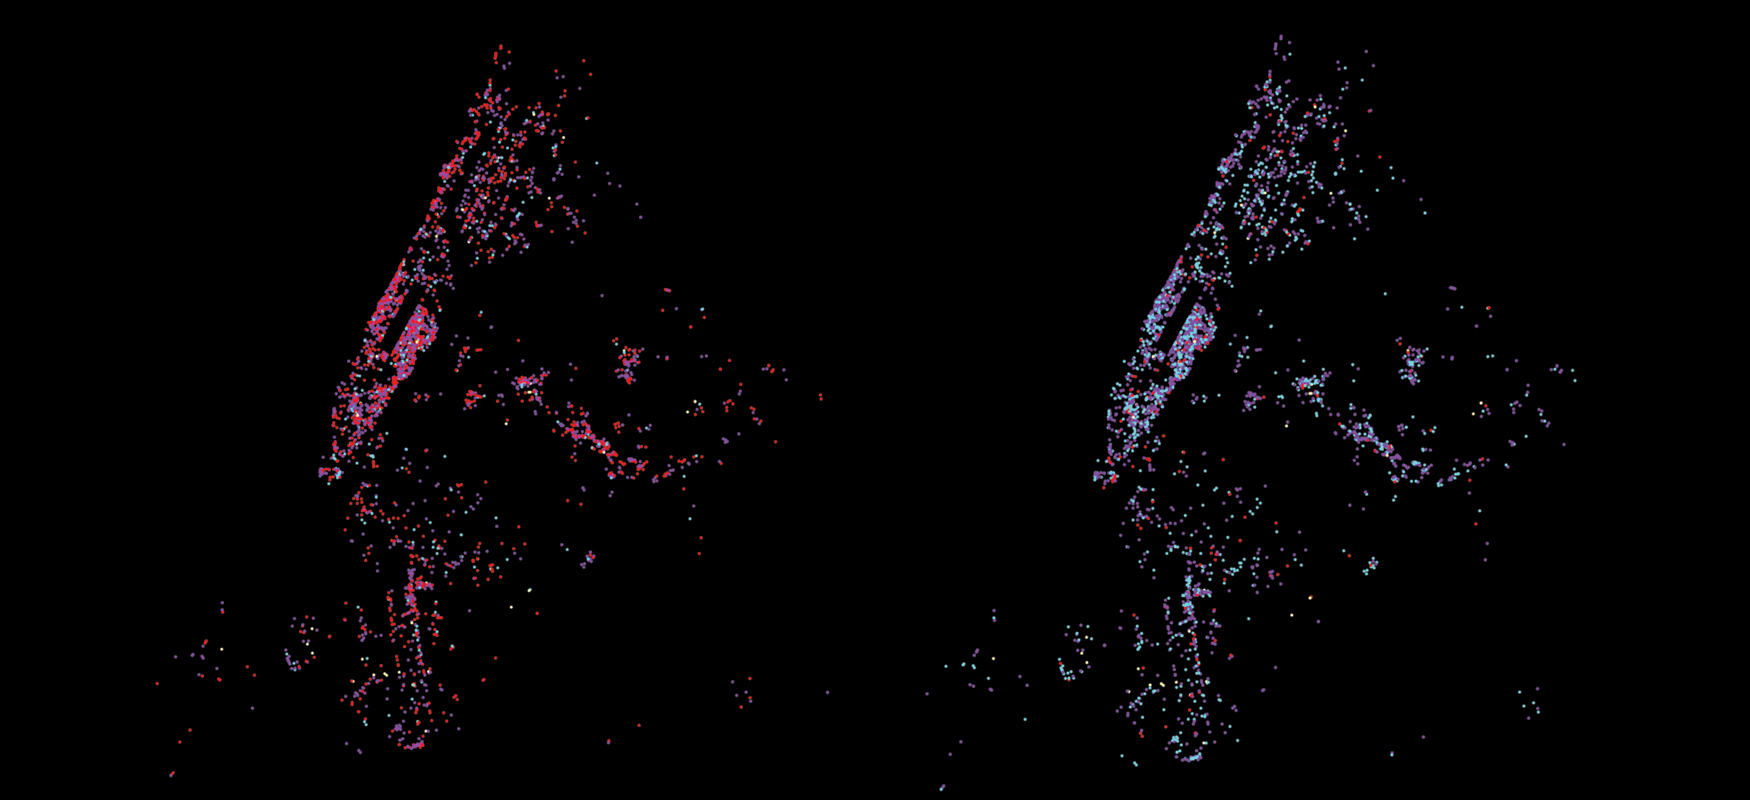
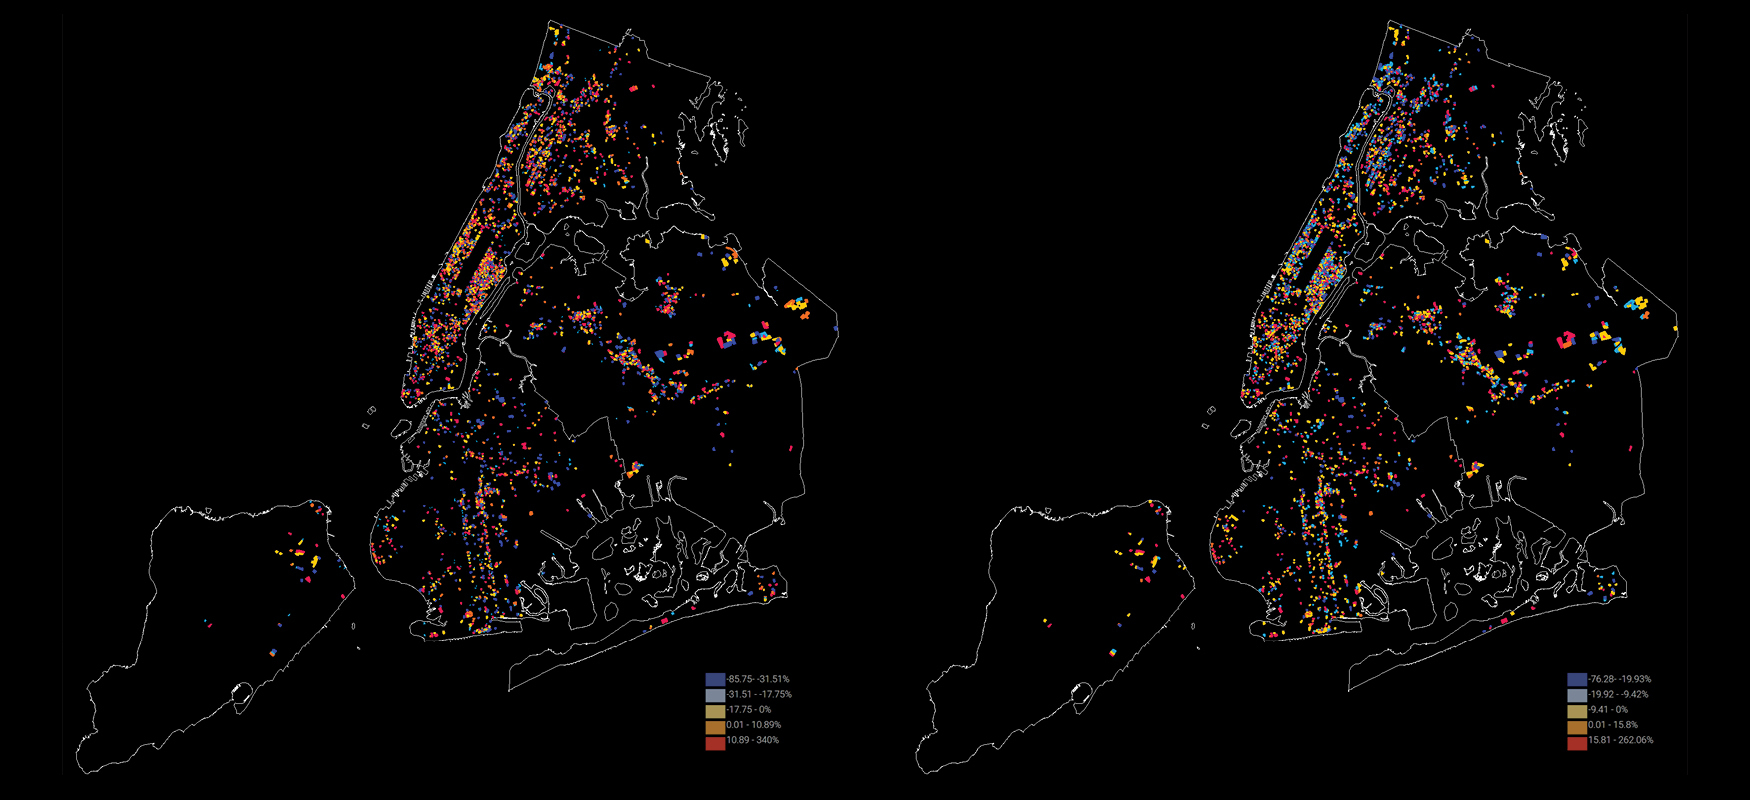 Left: Change in Building GHG Emissions from 2012-17 Right: Change
in Building GHG Emissions from 2012-17. Sample size: 3,243 buildings. The maximum decrease in GHG emissions was 85% and the maximum increase is 340%. As for EUI change the maximum decrease is 76% and the maximum increase is 260%.
Left: Change in Building GHG Emissions from 2012-17 Right: Change
in Building GHG Emissions from 2012-17. Sample size: 3,243 buildings. The maximum decrease in GHG emissions was 85% and the maximum increase is 340%. As for EUI change the maximum decrease is 76% and the maximum increase is 260%.
To understand the building EUI and GHG emissions intensity reduction pathways residential buildings should be set on, we reviewed past studies and reduction targets. According to the Urban Green Council, buildings that regularly benchmarked their energy use have decreased their energy usage by nearly 10 percent and their total emissions by almost 14 percent between 2010 and 2015. New York State’s Build Smart NY Program was established by Executive Order 88, and mandates a reduction in energy consumption by 20% in government owned and operated buildings by 2020 (from the baseline year of 2010/2011). Site utility data has been collected for all government buildings larger than 20,000 square feet and this has been converted to Source EUI, which is the performance metric used to achieve the 20% reduction targets.

The conclusion of the analysis shows that, generally, social and built environment factors do not have a strong effect on GHG emissions intensity and EUI change between 2012 and 2017 for LL84 compliant residential buildings. While the radar plots from the time series clustering analysis show inconclusive results, the results from our decision tree and random forest models show that year built is definitely an important feature for EUI and GHG emissions intensity change. Social factors, namely race and education, were also notably important features.
 Left: K-Means Clustering. Right: Hierarchial Clustering. The change in EUI and greenhouse gas intensity from 2012 to 2017 and ran two types of clustering to look for similar buildings. KMeans and Agglomerative yielded the same results, with 4 optimal clusters and identical results